


Market concentration: What does it mean for equity markets and diversified portfolios?

At a glance
- US mega-cap companies now have an unusually large influence on both US and global equity market returns.
- AI has reinforced market concentration, but expectations around future earnings and investment returns remain crucial.
- Diversification requires looking beyond fund labels to understand true exposure to dominant stocks, sectors and themes.
Market concentration is one of the key characteristics of today’s equity markets. In the US, the ten largest companies account for around 36% of the MSCI US Index1. Because the US dominates the world of equity investing, taking up more than 63% of the MSCI ACWI2, a commonly used global benchmark, these same large US companies also exert a substantial influence on global equity returns. Nine of the world’s ten largest companies are US-listed, and together they represent more than a fifth of the MSCI ACWI’s market capitalisation, exceeding the weight of every country market except the US. Matt Brennan, Head of Asset Allocation, considers market concentration, and the risks and opportunities it creates for investors.
Success creates success
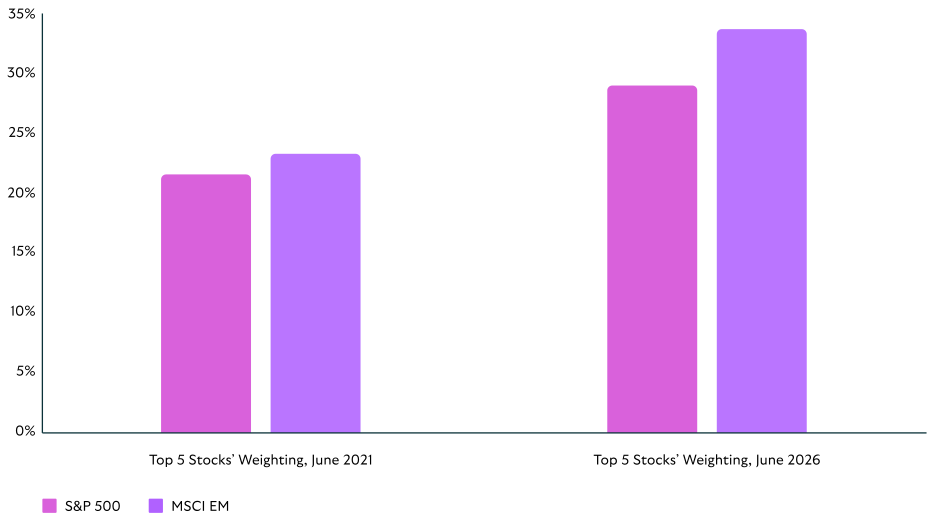
So, how did we get here? Most large equity markets show some degree of concentration, with several companies standing above the crowd. Companies that deliver sustained earnings growth, build strong balance sheets and create durable competitive positions tend to attract heavy investor demand, which in turn drives market outperformance. As their index weights rise, passive flows reinforce this dynamic, creating a feedback loop in which success produces further success. Active managers in momentum funds and retail investors may also bolster this demand. Where the addressable market is sufficiently large – like, Apple in smartphones or Microsoft in operating systems – the most successful companies can become market giants, where their share movements can exert an influence on the performance of the entire market in which they are listed. Market concentration has increased in recent years. Figure 1 shows how the largest five stocks have seen their weight increase in both the S&P 500 Index in the US and the MSCI Emerging Markets Index over the past five years.
Increasing concentration
Source: Bloomberg
AI+
As well as leading in market-cap terms, the US dominates global markets through the breadth, liquidity and infrastructure of its equity market. Having led many investment cycles over the past century or so, the US has again been at the centre of the current strength in technology and communication services because of positive expectations surrounding artificial intelligence (AI). The AI theme has propelled several incumbent mega-caps higher and created new market leaders. For example, Nvidia: Five years ago, it was not in the same bracket as the incumbent titans, but the AI adoption trade has helped it become the largest company in the world2.
The AI theme has propelled several incumbent mega-caps higher and created new market leaders.”
Ongoing focus and pressures
With AI-related companies Anthropic and OpenAI potentially undertaking large IPOs soon, there is likely to be further focus on technology and communication services shares and their substantial slices of the US market. While further earnings strength in the leading AI and broader tech companies could reinforce that focus.
US and mega-cap domination to continue?
If this segment does fall back, it could cause heavy volatility in the US and global markets. So, what could cause weakness in these large stocks?
Despite the attention received by the mega-caps, their top-of-the-pile position is not insurmountable. Valuations levels could be reassessed if growth underperforms expectations, or if the incredible scale of the capital expenditure boom on the back of AI proves hard to justify. Tech companies have been sinking trillions of dollars into data centres and chip infrastructure in readiness for hoped-for sustainable revenue generation from these assets. The equity market will be analysing this ongoing spend carefully. Pressure from higher interest rates could impact budgets and investment plans, and restrictive regulation, supply chain pressures or potential market maturation or saturation could also constrain the sector. Market leadership tends to evolve, but these changes often play out over long horizons and with timing that is difficult to forecast.
One route to broader market leadership could come from AI adoption outside the technology sector. If companies in other industries can translate AI-enabled efficiencies into higher margins or stronger earnings growth, investors may begin to reward a wider set of beneficiaries. Even if the current technology leaders continue to compound earnings, periods of volatility are likely when markets question the pace of adoption, the scale of investment required or the relative appeal of more defensive sectors.
It’s not just US companies
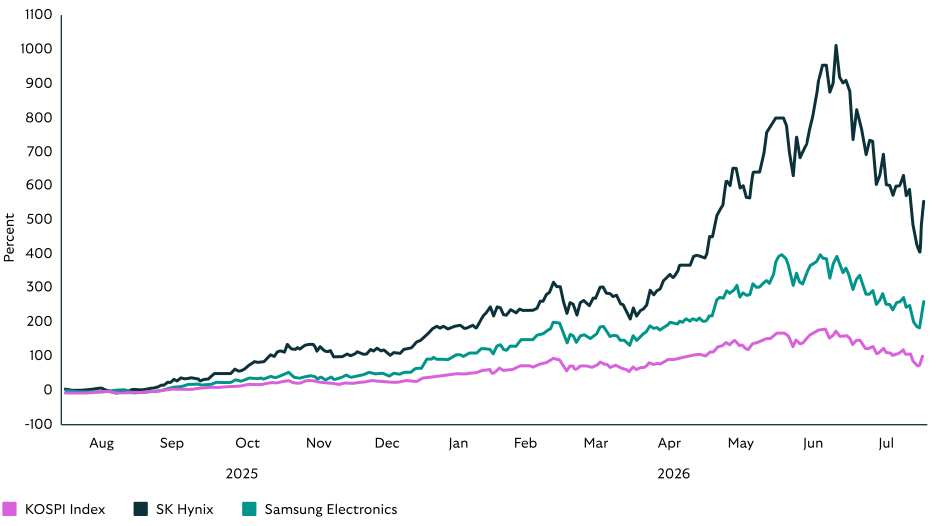
It is important to point out that concentration is not just an issue confined to US equities, but it is the US that holds the greatest sway over global markets. Taiwan Semiconductor Manufacturing Company (commonly known as TSMC) is the only non-US stock in the MSCI ACWI top ten, and it accounts for more than half of the MSCI Taiwan Index and more than 15% of the MSCI Emerging Markets Index. Korea’s top five stocks account for over two-thirds of its market, which rose almost 100% in sterling terms over the year to 31st July, mostly driven by large-cap stocks benefitting from the AI hardware ecosystem3. Figure 2 shows the strong rise in the two largest Korean stocks, driven by the AI, theme and the underlying stock index, which benefitted from their upward pull but also fell back when these stocks declined in July 2026. In France, the ten largest CAC 40 constituents –including LVMH, TotalEnergies and Schneider Electric – account for around 60% of the index. Across Europe more broadly, the ten largest constituents of the MSCI Europe ex UK Index represent roughly a quarter of this benchmark.
South Korea equity market
Source: KRX, Macrobond, Scottish Widows
Multi-asset portfolio managers must look through fund categorisation to understand true economic exposure to large stocks.”
What does this mean for multi-asset portfolios?
Market concentration should not be treated as an automatic red flag, nor necessarily as a reason to avoid the companies that have driven returns in recent years. In many cases, concentration reflects strong earnings growth, high capital returns and a robust competitive advantage. But it does mean investors need to be clear about what they own, and they price they pay to buy into markets. A portfolio can look diversified by number of holdings, regions or funds while still being heavily exposed to a narrow set of stocks, sectors or themes. It is therefore important to know whether that exposure is suitably sized, and the risks-return tradeoff understood.
The same issue impacts multi-asset portfolio managers, who must look through fund categorisation to understand true economic exposure, especially if the giant stocks appear across growth, technology, thematic, regional and global funds. The aim is to ensure diversification genuinely reduces risk and helps smooth returns, rather than simply adding holdings that behave in the same way.
Active managers also face another dilemma: Being underweight the largest stocks can create significant relative performance headwinds if market leadership persists, even if the other stocks in their portfolio perform solidly, but owning mega-cap stocks to limit benchmark risk can reduce portfolio differentiation.
While equities form the cornerstone of the growth element of our multi-asset portfolios, we are more cautious on equities from here, in part due to market concentration and the relatively extended valuation levels of some key markets. We have seen how sharply the Korean market rose, but its near-100% 12-month gain took in the month of July 2026, which saw it retreat almost 17%, underscoring the potential for pullbacks to be sharp in concentrated conditions. As such, any short-term bouts of negativity focused on the US mega-caps could make for particularly sharp periods of volatility.
*All index data sourced from FE Analytics and shown in total return sterling, unless stated otherwise.
Takeaways
- Concentration can reflect the strength of successful companies, but it can also magnify volatility when sentiment changes.
- The dominance of US technology and AI-related stocks means global investors need to be aware of their exposure to a narrow group of large companies.
- Portfolio construction should focus on whether exposures are appropriately sized and genuinely diversified.
1 MSCI US (USD), Index Factsheet, 31 July 2026
2 MSCI ACWI (USD), Index Factsheet, 31 July 2026
3 Korea Stock Exchange Composite Index (KOSPI)


