


Multi-Asset: Boring is still beautiful for the second half of 2026

Looking ahead to the next six months, Richard Bernstein, Global Head of Macro & Customized Investing, explains why it may prove prudent not to follow the risk-taking herd.
The financial markets and the betting markets serve vastly different purposes within the economy, but at the mid-point of 2026, it seems clear that there is abnormal speculation in the current economy, because investors are equating the two. In our view, investors would be better served sticking to fundamentals and leaving chance to the betting community.
The financial markets exist for capital formation. Investors take ownership positions in companies or lend to companies, which lowers those companies’ cost of capital and fuels capital investment and employment. The betting markets serve no similar value-added purpose to the broader economy; participants simply wager on an outcome.
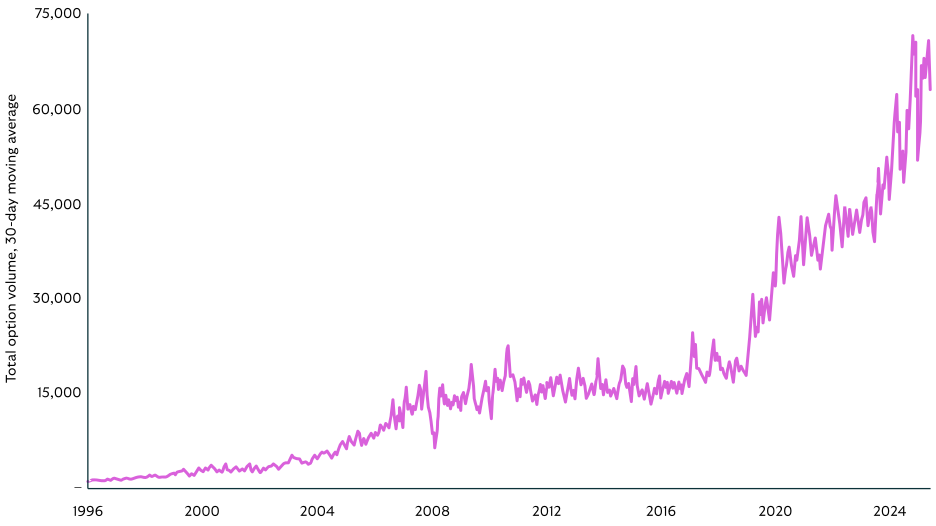
Exhibit 1 suggests that total options volume reflects the increasingly speculative nature of the financial markets. The embedded leverage within options provides investors with a higher-risk/higher-return method to potentially increase stock returns. Despite the increased risk of using options, trading volume has more than tripled in the last five years.
Given the speculative backdrop, our 2026 outlook was titled “Boring is Beautiful” and advocated for positions in dividend-paying stocks, non-U.S. stocks, shorter-term higher-quality fixed income, and gold.
Exhibit 1: Spiraling options volumes illustrate the increasingly speculative nature of markets
Source: Bloomberg, as at 31 May 2026.
Investors are reassessing the Fed
One of our primary assumptions at the beginning of the year was that the U.S. Federal Reserve (Fed) would not be able to cut rates as rapidly or as demonstrably as was consensus. In fact, we thought there was a probability that the Fed would need to shift course and increase rates.
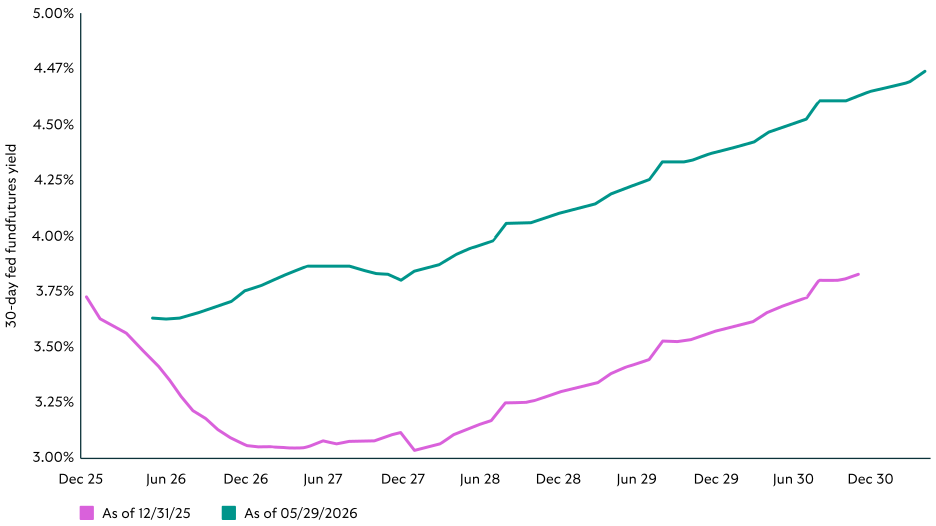
That out-of-consensus view is apparently becoming more mainstream. Exhibit 2 shows the futures market’s forecast for the federal funds rate. At the end of 2025 (amber line) the markets were predicting the fed funds rate would be lowered during 2026 and would not get back to current levels until 2030. The current view (white line) anticipates much higher rates, with only a small rate cut anticipated this summer and rates following a decidedly upward trajectory over the next five years.
Exhibit 2: A markedly different interest-rate path compared to the beginning of the year
Source: Bloomberg, as at 31 May 2026.
The near-term optimism regarding a potential rate cut might still be too optimistic.”
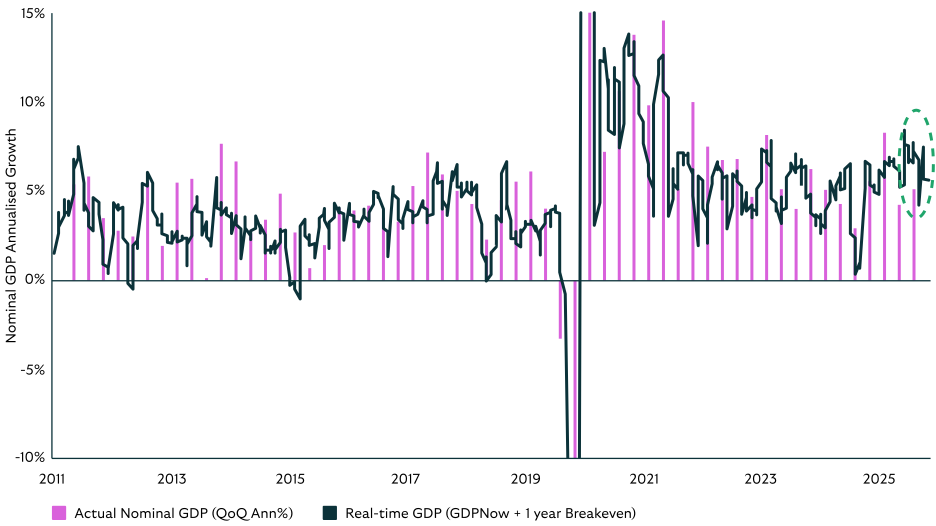
The near-term optimism regarding a potential rate cut might still be too optimistic. Exhibit 3 shows our simple real-time measure of Nominal Gross Domestic Product (GDP) (real GDP plus inflation) incorporating the Atlanta Fed’s GDPNow forecast and one-year inflation breakevens. The bars in the chart represent actual Nominal GDP as was reported.
The nominal U.S. economic growth has been extraordinarily strong. Nominal GDP in the third quarter of 2025 was over 8%, which was, when excluding the pandemic and post-pandemic period, the first 8% nominal GDP quarter in roughly 20 years. The fourth quarter was slower because of the government shutdown, but first-quarter 2026 nominal GDP was greater than 5.5%, and the current quarter is so far tracking back above 7%.
We continue to believe that such strong nominal growth will limit the Fed’s flexibility, that they will gradually shift toward a tightening bias, and that they could actually raise rates.
Exhibit 3: U.S. economic growth remains extraordinarily strong
Source: Bloomberg, as at 31 May 2026.
Fundamentals matter more when liquidity dries up
Liquidity has historically been the lifeblood of speculation, and highly speculative periods tend to end when the Fed raises rates. History also indicates that when liquidity dissipates, investors focus more on fundamentals than on recent stock performance and momentum.
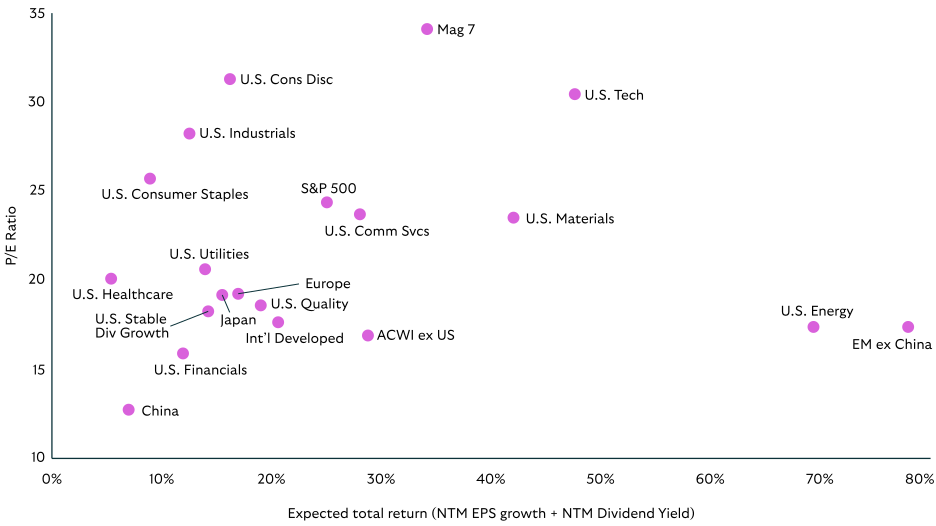
Exhibit 4 compares the fundamentals of major equity categories. It shows expected total return (defined as earnings growth plus dividend yield) versus valuation. Categories toward the lower left are viewed as more attractive, whereas those toward the upper right are less attractive.
Equity market segments such as dividends and non-U.S. stocks appear much more attractive than the consensus favorite, the so-called Magnificent 7 (Mag 7) stocks, or the broader Technology sector.
Exhibit 4: Opportunities beyond the Mag 7 and Tech
Source: Richard Bernstein Advisors LLC, MSCI, S&P Global, Bloomberg Finance L.P., as at 31 May 2026. NTM = Next twelve months. Sectors are defined as S&P 500® GICS Sectors. U.S. Quality: MSCI USA Sector Neutral Quality Index measures the performance of U.S. large- and mid-capitalization stocks exhibiting relatively higher quality characteristics as identified through three fundamental variables: Return on equity, earnings variability, and debt-to-equity. U.S. Stable Div Growth: S&P High Yield Dividend Aristocrats Index. The index measures the performance of the highest dividend yielding S&P Composite 1500 Index constituents that have followed a managed-dividends policy consistently increasing dividends every year for at least 20 consecutive years.
Our research over the past 35 years strongly suggests that lower-quality investments, both equities and fixed income, provide higher longer-term returns.”
Not a time for credit risk
Most investors are aware that higher returns generally involve taking more risk, and our research over the past 35 years strongly suggests that lower-quality investments, both equities and fixed income, provide higher longer-term returns. However, entry points are very important.
Investing when equity valuation is very high or fixed-income spreads are very narrow implies that risk premia are too small. In other words, an investor is not being compensated for the investment’s risk, and the probability of an investment underperforming is greater.
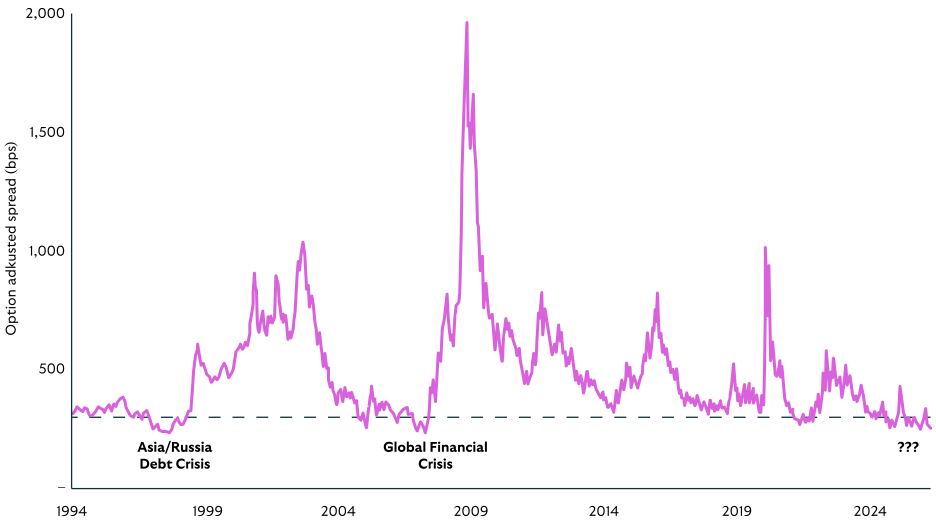
Exhibit 5 highlights the narrowness of today’s high-yield corporate credit spreads. In fact, spreads have been narrower than they are today only twice in the last 30 years, and major credit events followed each occurrence. Given that history, we continue to focus on shorter-term, higher-quality fixed income such as municipals, Treasuries, and mortgages.
With nominal growth being stronger than investors currently expect and the Fed’s potential inability to lower rates, fixed income investors may be best served by maintaining duration at lower levels than those of the benchmark.
Exhibit 5: High-yield corporate credit spreads have only been this narrow twice before
Source: Bloomberg, as at 31 May 2026.
Boring remains beautiful
Investors’ risk preferences historically swing back and forth from very cautious risk aversion to wild risk taking. At the beginning of the bull market, investors would only invest in quality dividend-bearing stocks and Treasuries. Today, when the lines are blurred between capital markets and prediction markets, no level of equity or fixed income risk seems to satisfy gambling cravings.
Instead of following the risk-taking herd, we are sticking to the fundamentals that continue to suggest boring investments are quite attractive. Dividends, non-U.S. equities, and short-term quality fixed income continue to form the basis of our allocations for the second half of 2026.
The views presented are as of the date published. They are for information purposes only and should not be used or construed as investment, legal or tax advice or as an offer to sell, a solicitation of an offer to buy, or a recommendation to buy, sell or hold any security, investment strategy or market sector. Nothing in this material shall be deemed to be a direct or indirect provision of investment management services specific to any client requirements. Opinions and examples are meant as an illustration of broader themes, are not an indication of trading intent, are subject to change and may not reflect the views of others in the organization. It is not intended to indicate or imply that any illustration/example mentioned is now or was ever held in any portfolio. No forecasts can be guaranteed and there is no guarantee that the information supplied is complete or timely, nor are there any warranties with regard to the results obtained from its use. Janus Henderson Investors is the source of data unless otherwise indicated, and has reasonable belief to rely on information and data sourced from third parties. Past performance does not predict future returns. Investing involves risk, including the possible loss of principal and fluctuation of value.
Not all products or services are available in all jurisdictions. This material or information contained in it may be restricted by law, may not be reproduced or referred to without express written permission or used in any jurisdiction or circumstance in which its use would be unlawful. Janus Henderson is not responsible for any unlawful distribution of this material to any third parties, in whole or in part. The contents of this material have not been approved or endorsed by any regulatory agency.
Janus Henderson Investors is the name under which investment products and services are provided by the entities identified in Europe by Janus Henderson Investors International Limited (reg no. 3594615), Janus Henderson Investors UK Limited (reg. no. 906355), Janus Henderson Fund Management UK Limited (reg. no. 2678531), Tabula Investment Management Limited (reg. no. 11286661), (each registered in England and Wales at 201 Bishopsgate, London EC2M 3AE and regulated by the Financial Conduct Authority) and Janus Henderson Investors Europe S.A. (reg no. B22848 at 78, Avenue de la Liberté, L-1930 Luxembourg, Luxembourg and regulated by the Commission de Surveillance du Secteur Financier).
Outside of the U.S.: For use only by institutional, professional, qualified and sophisticated investors, qualified distributors, wholesale investors and wholesale clients as defined by the applicable jurisdiction. Not for public viewing or distribution. Marketing Communication.
Janus Henderson® and any other trademarks used herein are trademarks of Janus Henderson Group Ltd. or one of its subsidiaries. © Janus Henderson Group Ltd.


